Your Go Service Is Getting OOMKilled and It Isn't a Leak
A highly concurrent Go service kept dying with exit code 137 in Kubernetes, but pprof showed no leak. The problem was that the Go runtime had no idea the pod had a memory limit. This is what GOMEMLIMIT fixes.
Art consists of limitation. The most beautiful part of every picture is the frame.
G. K. Chesterton
A while back I was investigating a highly concurrent Go service that kept restarting in its Kubernetes pod during sudden bursts of traffic. Exit code 137 — 128 + 9, a SIGKILL from the kernel's OOM killer.
My first guess was the obvious one: a memory leak. But pprof didn't agree. Under heavy load the in-use heap was fairly small, and the inuse_space profile looked healthy. It was the alloc_space profile that showed what was actually going on — the service was churning through enormous volumes of short-lived allocations, and nothing was telling the runtime to slow down.
There was no leak. The runtime was doing exactly what it had been told to do. The problem was what it hadn't been told.
Two accountants, no shared ledger
For a Go service running in Kubernetes, two separate systems have an opinion about memory, and before Go 1.19 they barely spoke to each other.
The first is the cgroup. It enforces the pod's resources.limits.memory at the kernel level. It is not negotiable and it does not warn you — when the process crosses the line, the OOM killer takes it.
The second is the Go runtime. Its only real lever was GOGC, which controls how large the heap may grow relative to the live set. The default, GOGC=100, means "let the heap roughly double before collecting again."
Notice what's missing from that sentence: any absolute number. GOGC is a ratio, and a ratio has no ceiling. If the live set grows, the target grows with it. The runtime has no idea a 1 GiB limit exists, so it does the reasonable thing and keeps growing the heap — right through the limit and into the OOM killer.
That's the whole bug. Not a leak: a units mismatch. The cgroup thinks in bytes, and the runtime was thinking in percentages.
Why tuning GOGC isn't the answer
The obvious workaround is to turn GOGC down. Set GOGC=50 and the heap only grows 1.5x between collections instead of 2x.
It works, in the narrow sense that the process stops dying. But it's the wrong instrument, for two reasons.
It's still a ratio, so it still has no ceiling — you have made the OOM less likely without making it impossible. And it applies the same aggression at all times. A service sitting at 5% of its memory budget pays exactly the same GC tax as one sitting at 95%. You end up burning CPU on collections you didn't need, permanently, to protect against a burst that happens occasionally.
What you actually want is a runtime that relaxes when there's headroom and gets serious as the budget runs out.
GOMEMLIMIT: telling the runtime about the budget
That is precisely what Go 1.19's GOMEMLIMIT provides. It tells the runtime: this is roughly how much memory you're allowed to burn before Kubernetes gets angry.
It's a soft limit on Go-managed memory — the heap, goroutine stacks, and runtime overhead. The behaviour is adaptive in the way GOGC isn't:
- While usage sits comfortably below the limit, GC behaves normally and
GOGCgoverns as usual. - As usage approaches the limit, the GC runs more frequently, trading CPU to keep the process inside its budget.
So the runtime finally has the one piece of information the cgroup always had, and it can make its own trade-offs with that number in hand.
Picking a value
There's no universally correct value, and it depends on your workload. A reasonable starting point is 70–80% of the pod's actual memory limit.
For a 1 GiB pod that lands around 700–800 MiB. The remaining 200–300 MiB isn't waste — it's the memory GOMEMLIMIT doesn't govern, and you need it: the binary itself, thread stacks, OS page cache, any cgo allocations.
Set it too close to the pod limit and you've defeated the point, because the ungoverned memory pushes you over anyway. Set it too low and you're paying the aggressive-GC tax you were trying to avoid.
Setting it
As an environment variable, which is usually where it belongs — it lets you change the value without a rebuild, and keeps it next to the pod limit it's derived from:
env:
  - name: GOMEMLIMIT
    value: "800MiB"
Or in code:
import "runtime/debug"

func init() {
    debug.SetMemoryLimit(700 << 20) // 700 MiB
}
One warning about the environment variable: it takes size suffixes like MiB and GiB, but a bare number is interpreted as bytes. GOMEMLIMIT=800 sets a limit of 800 bytes, not 800 MiB, and the runtime will accept it and immediately GC itself to death. This is an easy typo to make in a manifest and a confusing one to debug.
Better still, derive it from the cgroup at startup rather than hardcoding it in two places that can drift apart. The automemlimit package reads the container's actual limit and sets GOMEMLIMIT to a percentage of it.
What it looked like
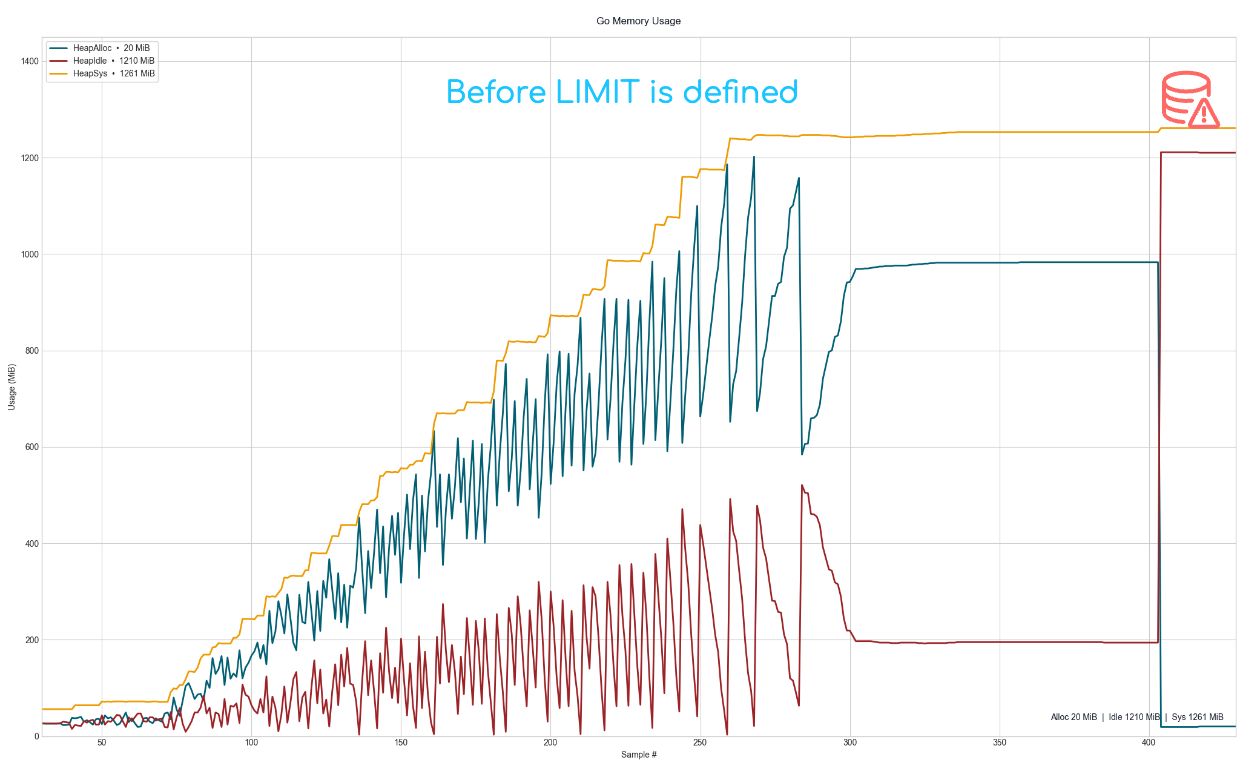
Before, with no limit defined — the heap climbs until the cgroup ends the process. HeapSys peaks past 1200 MiB, and the flat line at the right edge is the pod dying:
After, with GOMEMLIMIT set — same workload, same traffic. HeapAlloc still swings hard with the bursts, which is expected and fine. What changed is that HeapSys flattens out around 763 MiB instead of climbing forever:
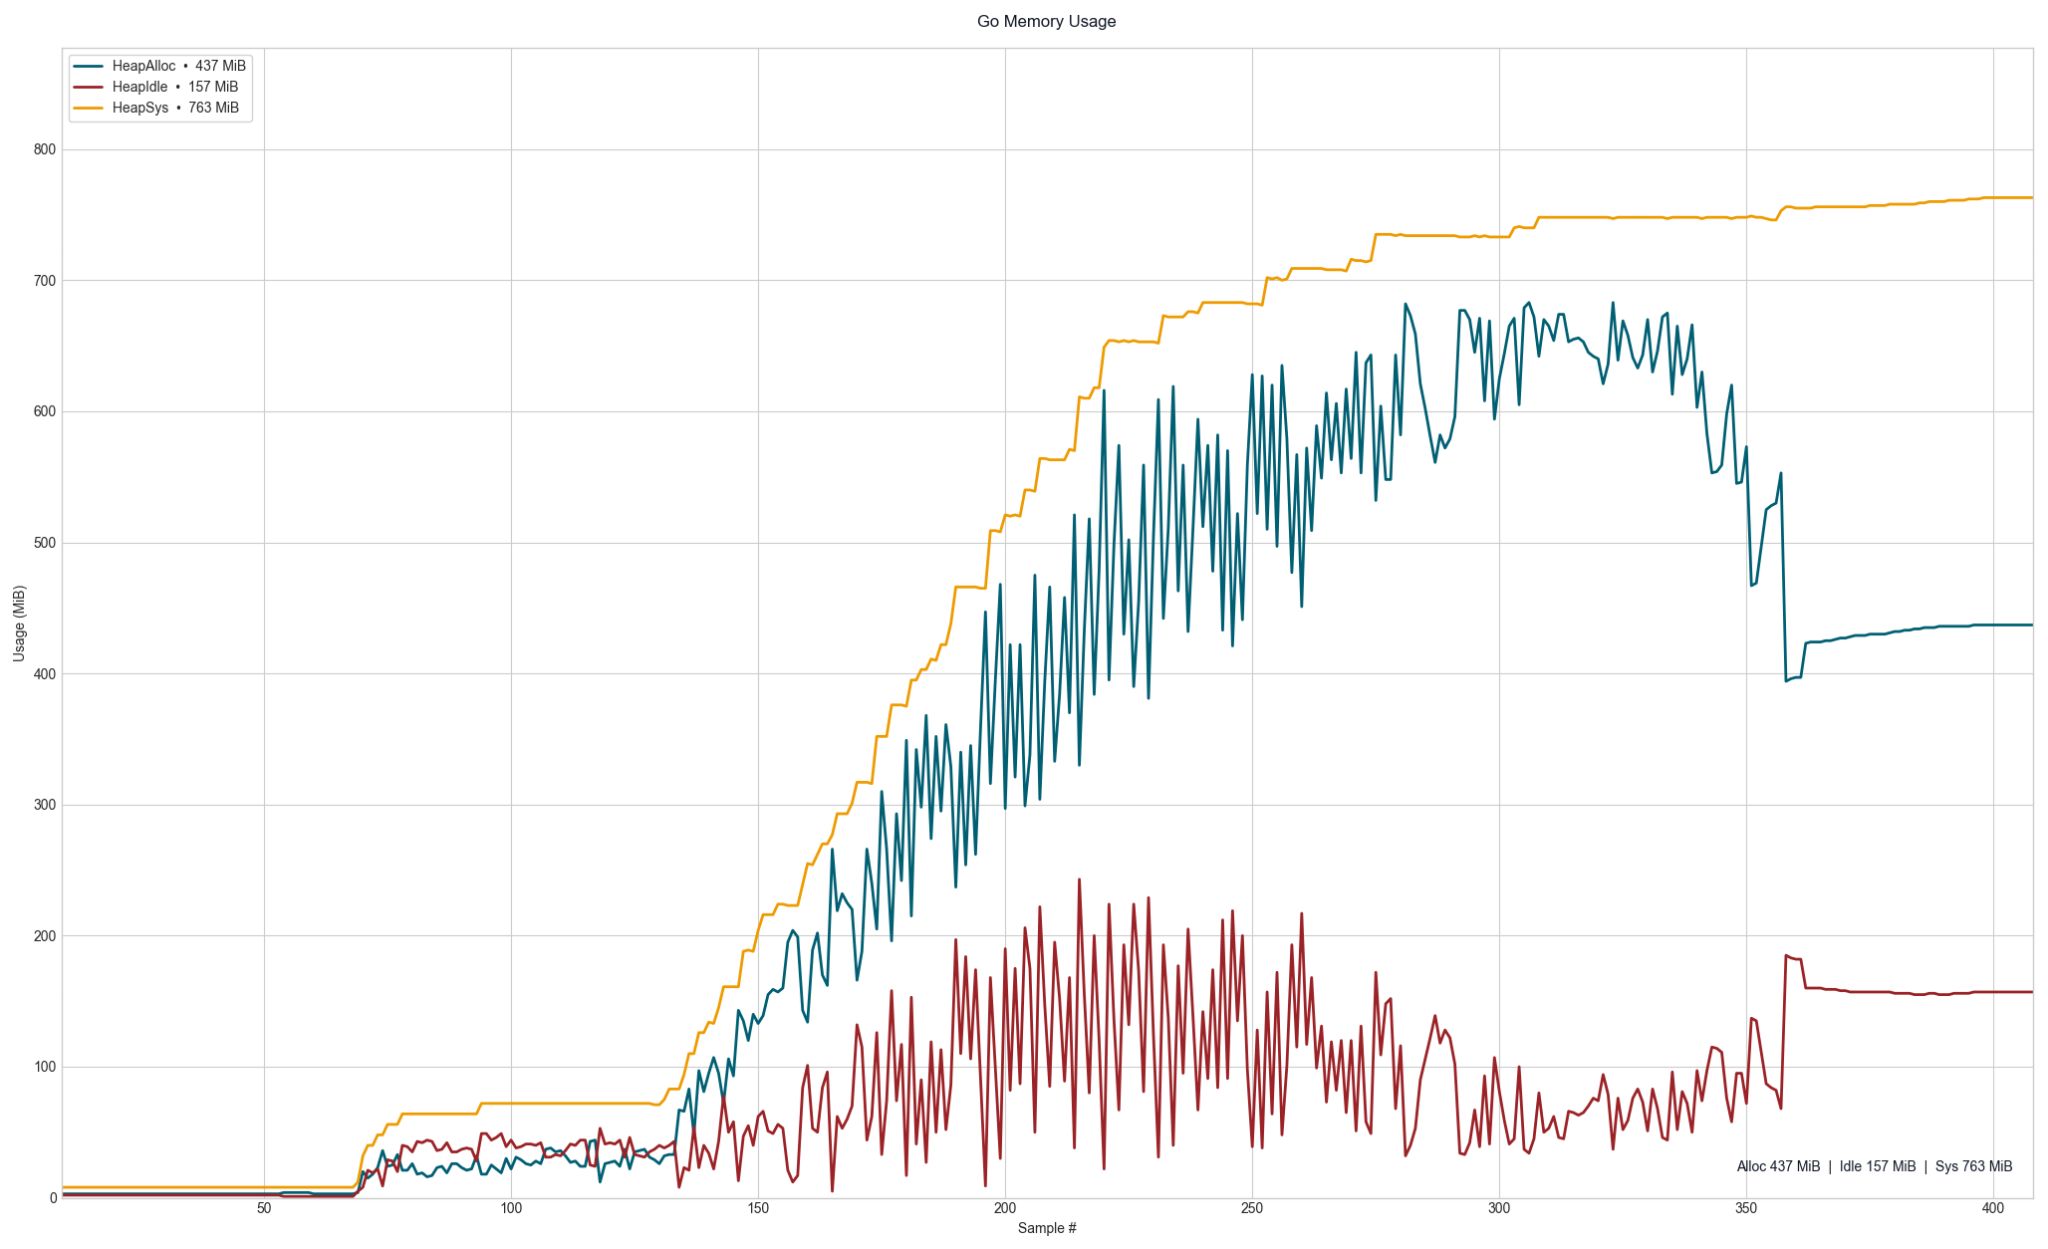
The service stopped restarting. Note that the sawtooth in HeapAlloc didn't go away, and it shouldn't — the allocation pattern was never the problem. The ceiling was.
What GOMEMLIMIT does not cover
Two caveats worth knowing before you reach for it.
It only governs Go-managed memory. Allocations made through cgo, memory-mapped files, and the OS page cache all sit outside its accounting. If a meaningful share of your footprint is non-Go, budget for it explicitly in the headroom you leave.
It's soft, and that matters when the live set genuinely doesn't fit. If your live heap legitimately exceeds the limit, the runtime will not kill your process — it will keep collecting, harder and harder, trying to get under a line it cannot reach. That's a GC death spiral: the service stays alive but burns most of its CPU on garbage collection. Go mitigates this by capping GC at roughly 50% of CPU, so you get a service that's slow rather than one that's wedged. Still, a sudden CPU spike with no throughput to show for it is the signature to watch for, and it means your limit is too low for the work — not that GOMEMLIMIT is misbehaving.
The takeaway
Without GOMEMLIMIT, the Go runtime behaves as though RAM is infinite. It isn't being reckless; nobody told it otherwise. Set the limit and it works within a defined budget and actively avoids growing past it.
If you're running Go in Kubernetes and you've never set it, you are relying on GOGC's ratio happening to stay under a ceiling it has never been shown. That works right up until a traffic burst, which is exactly when you'd rather it didn't fail.